
Dunder Data Challenge #3 - Naive Solution
To view the problem setup, go to the Dunder Data Challenge #3 post. This post will contain the solution.
Master Data Analysis with Python
Master Data Analysis with Python is an extremely comprehensive course that will help you learn pandas to do data analysis.
I believe that it is the best possible resource available for learning how to data analysis with pandas and provide a 30-day 100% money back guarantee if you are not satisfied.
Solution
I will first present a naive solution that returns the correct results, but is extremely slow. It uses a large custom function with the groupby apply method. Using the groupby apply method has potential to capsize your program as performance can be awful.
One of my first attempts at using a groupby apply to solve a complex grouping problem resulted in a computation that took about eight hours to finish. The dataset was fairly large, at around a million rows, but could still easily fit in memory. I eventually ended up solving the problem using SAS (and not pandas) and shrank the execution time down to a few minutes. This is not an endorsement of SAS, but rather a warning that poor knowledge of how pandas works can lead to horrific performance issues.
Built-in vs Custom groupby functions
This is a difficult challenge because each aggregation requires a custom calculation that is not provided directly as a pandas groupby method. For example, taking the sum of a column in each group is a simple groupby operation that is built into pandas. No custom function is needed. Here is an example of how we can sum all the revenue for each group.
df.groupby([‘country’, ‘region’]).agg({‘revenue’:’sum’}).head()
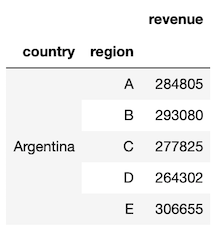
Measuring the performance of this operation with the timeit magic command yields about 25ms for completion.
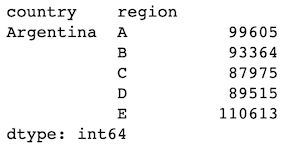
Alternatively, we can define a simple custom function which computes the same sum. A pandas Series of the revenue values is passed to the custom function for each group.
def custom_sum(x):
    return x.sum()
df.groupby(['country', 'region']).agg({'revenue': custom_sum})
Measuring the performance of this custom function, which only has a single line of code has already more than doubled execution time to 60ms.
Let’s now define a slightly more demanding custom function, one where we return the sum of the revenue based on whether the cost_type column is ‘expert’. Here, we must use apply as it passes the entire DataFrame of each group to the custom function and not just the Series like agg does.
def custom_sum2(x):
    is_exp = x['cost_type'] == 'expert'
    return x.loc[is_exp, 'revenue'].sum()
df.groupby(['country', 'region']).apply(custom_sum2)
There is a better way to solve this problem and will be shown in the optimal second solution. Let’s first complete our challenge using a similar naive approach with a custom function passed to the apply groupby method.
Naive Solution — Use custom function with apply
This challenge lists 11 columns that must be returned in the result. Each of the columns returned requires some kind of customized operation that is not built into the pandas groupby. Let’s begin by calculating the first column, recency.
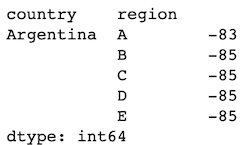
For every combination of country and region, we need to calculate the number of days between today and the ‘maximum’ (most recent) date. To do this we write the custom function, f1, which will accept the entire DataFrame as its argument.
def f1(x):
    today = pd.Timestamp('today')
    most_recent = x['date'].max()
    recency = (today - most_recent).days
    return recency
df.groupby(['country', 'region']).apply(f1)
Instead of returning the scalar result, we can return a Series with the index equal to the column name that we’d like to use, which will be the format for the remainder of this solution.
def f1(x):
    today = pd.Timestamp('today')
    most_recent = x['date'].max()
    recency = (today - most_recent).days
    d = {
        'recency': recency
        }
    return pd.Series(d)
df.groupby(['country', 'region']).apply(f1)
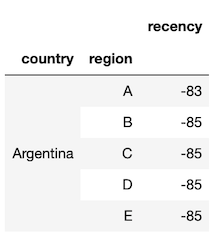
We measure performance and get 350ms. This doesn’t seem too bad for a dataset of 200k rows, but we have 10 more columns to compute.
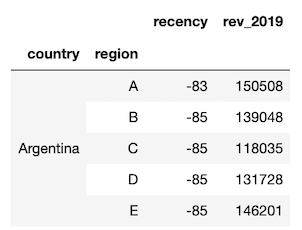
Let’s move on to the second column, rev_2019. We need to create a filter for revenue for only the first half of the year 2019.
def f2(x):
    is_2019H1 = x['date'].between('2019-01-01', '2019-06-30')
    recency = (pd.Timestamp('today') - x['date'].max()).days
    rev_2019 =         x.loc[is_2019H1, 'revenue'].sum()

    d = {
        'recency': recency,
        'rev_2019': rev_2019
        }
    return pd.Series(d)
df.groupby(['country', 'region']).apply(f2)
We can continue to develop our custom function until all columns are calculated in this manner. Here is the final function with all the calculations. Code is shown as an image for readability.
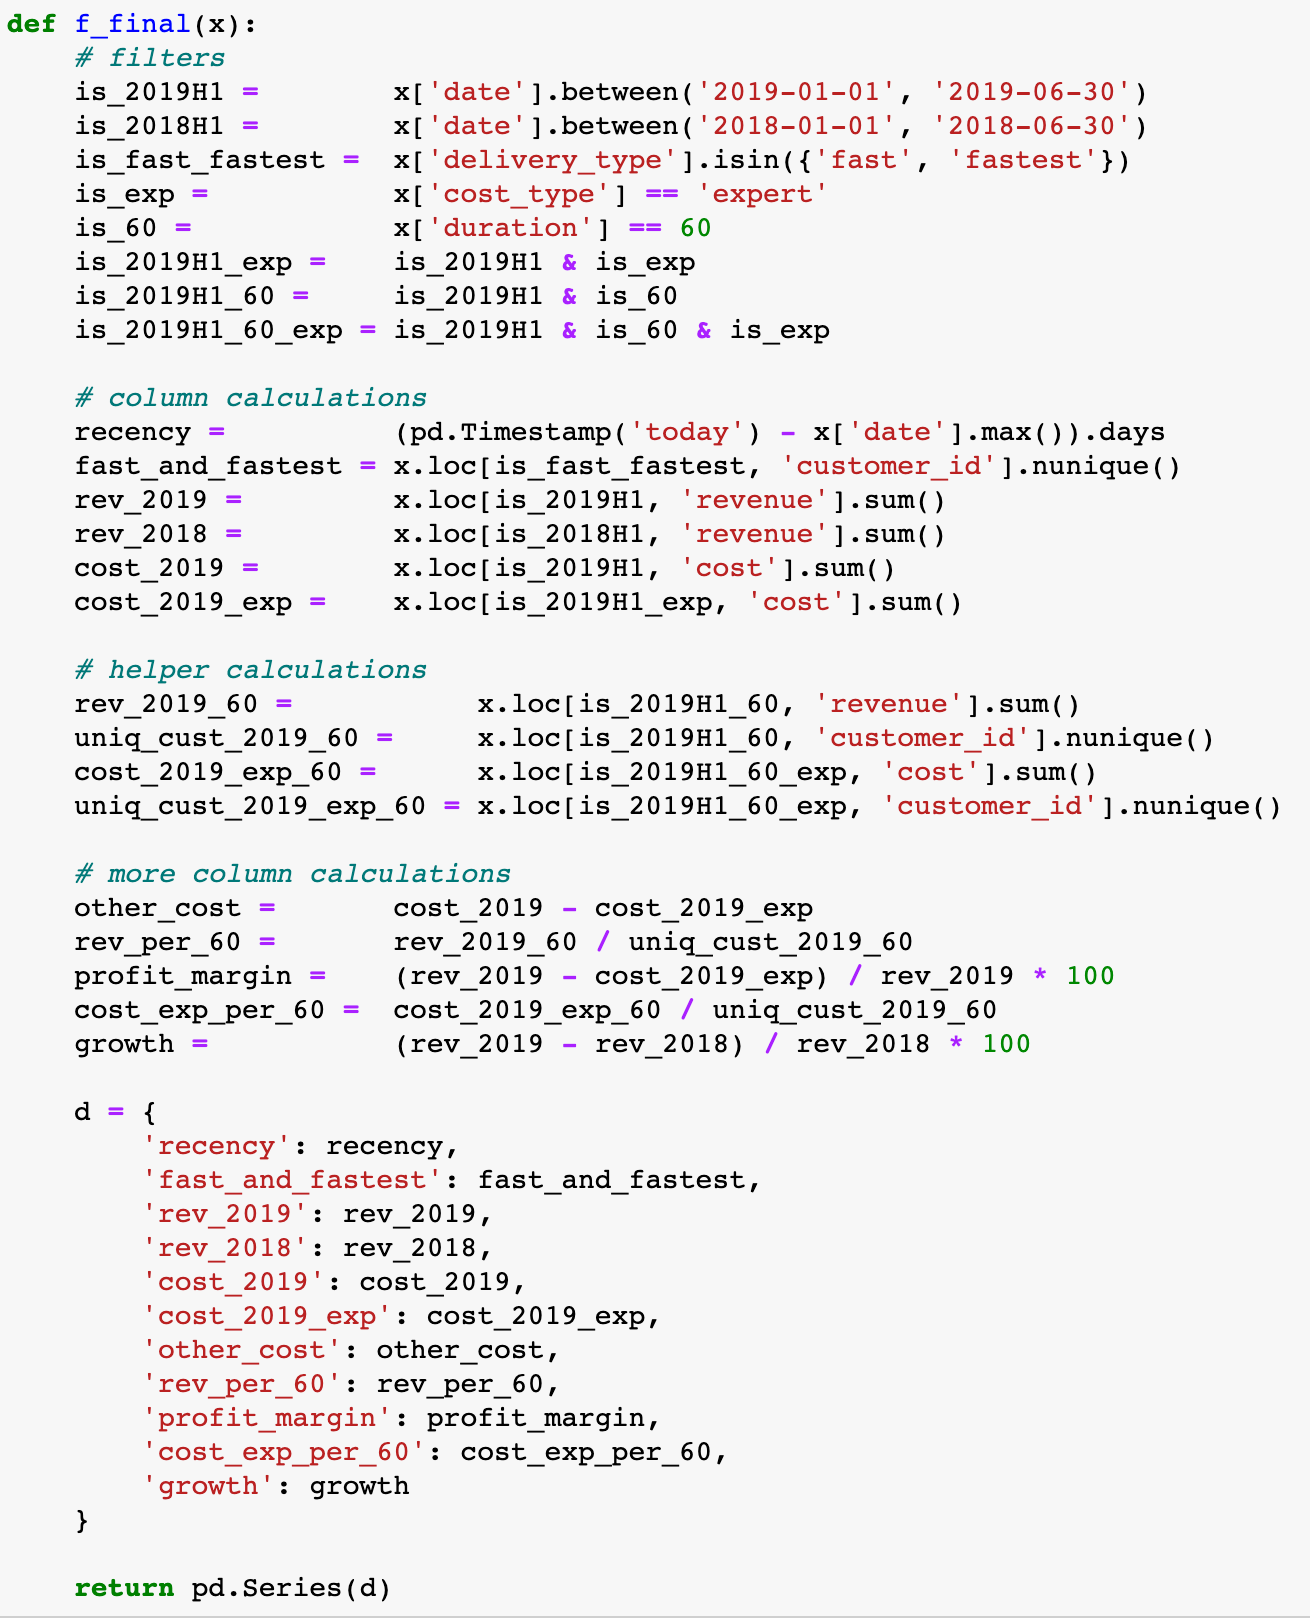
Applying this final function and formatting the resulting DataFrame yields the following.
df1 = df.groupby(['country', 'region']).apply(f_final)
df1.head().style.format('{:,.0f}')
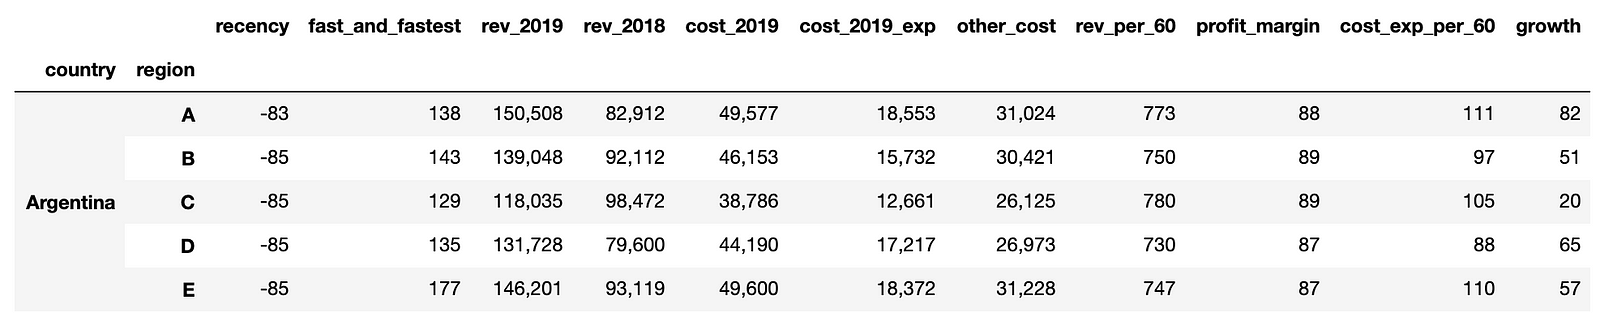
Our performance with this final function is more than 3.5 seconds. While this is a lot less than 8 hours, the calculations we performed in the custom function were fairly simple and our data was just 200k rows. If the data and complexity of the custom function increases by 1–2 order of magnitudes each, hours of computation time await.
Optimal Solution
Coming soon! Hint — apply the filters to the entire DataFrame first and only use built-in grouping methods.
Master Python, Data Science and Machine Learning
Immerse yourself in my comprehensive path for mastering data science and machine learning with Python. Purchase the All Access Pass to get lifetime access to all current and future courses. Some of the courses it contains:
- Master the Fundamentals of Python— A comprehensive introduction to Python (300+ pages, 150+ exercises)
- Master Data Analysis with Python — The most comprehensive course available to learn pandas. (800+ pages and 500+ exercises)
- Master Machine Learning with Python — A deep dive into doing machine learning with scikit-learn constantly updated to showcase the latest and greatest tools. (300+ pages)

Master Data Analysis with Python
Become an expert at using pandas to do data analysis with the comprehensive book Master Data Analysis with Python containing 500+ exercises and projects.
Recent Posts