Master Data Analysis with Python
The most comprehensive course available to learn data analysis and visualization in Python. Get access to over 850 pages of text, 500 exercises with detailed solutions, 10 hours of video, 5 certification exams, and multiple projects.
Become an Expert
Many other courses use poor practices to teach the data science libraries such as pandas, matplotlib, and seaborn. With Master Data Analysis with Python, you will be given the absolute best practices to use the libraries to help you rapidly transform into an expert.

Expert Instructor
Instructor Ted Petrou has taught more than 1,000 hours of live classes using this course. Each time he uses his experience to improve explanations and clarify results. Ted Petrou has become one of the foremost authorities on how to best use the python data science libraries.

Exercises and Projects
Reading texts or listening to lectures give the false impression of learning. To demonstrate learning, you must be able to complete tasks on your own. Master Data Analysis with Python comes with 500+ exercises and detailed solutions along with several longer and more complex projects.

Certification Exams
Multiple challenging certification exams are provided as you progress through the course. Passing these exams gives you confidence that you are becoming an expert at Pandas to analyze data.
Get Master Data Analysis with Python Now!
Bonus! Get Master Machine Learning with Python for Free!
For a limited time, get access to Master Machine Learning with Python (25 chapters and 225 pages of material) for free when you purchase Master Data Analysis with Python.
Master Data Analysis with Python contents
The course is divided into the following 13 parts. Each part can be considered its own mini-course with exercises and projects.
1. Intro to pandas
In Python, pandas is a popular and powerful library to explore, analyze, and visualize data. You will be introduced to the DataFrame and the Series, the two main containers of data within pandas. You will learn the components of these objects and a few basic operations.
Intro to pandas is available to take for free and is bundled together with the next part, Selecting Subsets of Data.
Take Intro to pandas for free
2. Selecting Subsets of Data
One of the most common tasks during a data analysis is to select some subset of the data. In pandas, you can select data by row/column label or integer location as well as with conditional logic applied to the values. Although this is a rather simple task, pandas offers multiple ways to complete it, which causes confusion to the novice user.
In this part, you will be given very clear instruction on what are best practices for subset selection. You will also learn what methods of subset selection you should avoid.
Take Selecting Subsets of Data for free
3. Essential Series Commands
In this part, you'll begin performing calculations on your data. You'll begin by learning to how to operate on a single column of data, a pandas Series. You'll learn the difference between methods that aggregate (return a single value) and those that do not. You'll learn how to access string-only and datetime-only operations to process Series with those specific data types.

4. Essential DataFrame Commands
After learning how to operate on a single column of data, you'll learn how to operate on multiple columns at the same time by calling methods on a DataFrame. You'll learn how to change the direction of the operations from vertical to horizontal.

5. Data Types
There are a huge number of data types that are available for your DataFrames. In this part, you'll get a comprehensive tour of the exact definitions of each data type and how to convert to and from each one.
You'll also learn about the categorical data type, which is unique to pandas, and has the ability to save a tremendous amount of memory.

6. Grouping Data
Up to this point in the course, all operations were applied to the entire dataset. You will learn how to apply operations to independent groups within your data instead of the whole.
You will also learn how to display the results of grouping in a more human-readable way with pivot tables.
Grouping data can be tricky in pandas and has potential to be one of the slowest performing operations. You will learn best practices on how to optimize performance along with the newest syntax available.

7. Time Series
A time series is a sequence of data observed over a period of time. The entire set of observed data is ordered by its time component. You will learn how to sample time series data at evenly spaced intervals, operate over a rolling window of time, and group by any time period you desire.

8. Regular Expressions
Regular expressions are a miniature programming language on their own that help you match patterns within text. They can be extremely useful when combined with the pandas string-only methods to manipulate and analyze strings in almost any way.

9. Tidy Data
Tidy data is a structure of data that makes analysis easier. Often, it is necessary to rearrange, transform, and extract data so that it conforms to tidy data principles. You will learn how to tidy a variety of 'messy' data sets with the tools given to you by pandas.

10. Joining Data
In this part, you will learn how to work with multiple data sets together. You will learn how pandas implicitly uses automatic alignment of the index to combine datasets causing problems for the novice. You will also learn how to make a variety of SQL-like joins.

11. Fundamentals of SQL
Master the fundamentals of relational databases, data models, and the SQL language. You'll learn how to connect to real-life databases and issue SQL SELECT statement commands to query the data and reproduce much of the same analysis that you did with pandas.

12. Visualization with Matplotlib
A good visualization can make for easier understanding and decision making. In this part, you will learn a straightforward approach to using the powerful, yet confusing library matplotlib.

13. Visualization with Pandas and Seaborn
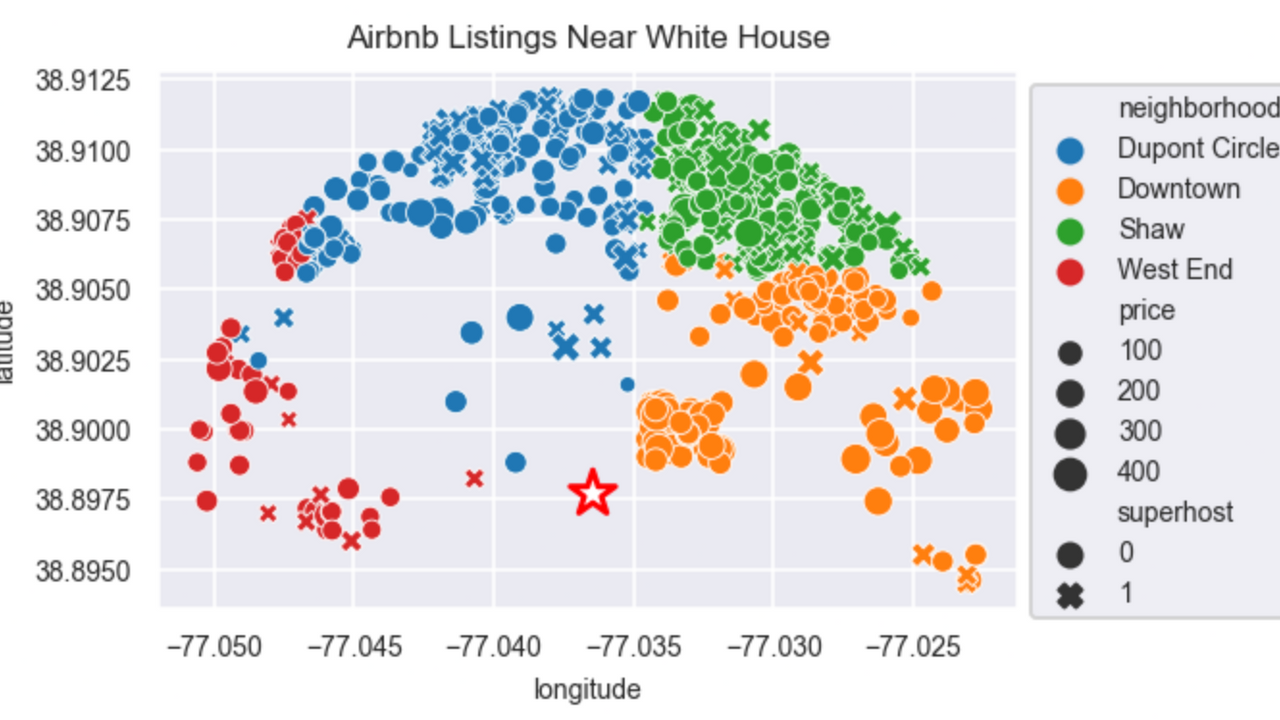
Learn how to plot data using pandas, before simplifying the process with the seaborn data visualization library. Seaborn provides a simple and intuitive interface for making beautiful plots directly from a Pandas DataFrame. When users arrange their data in tidy form, the Seaborn plotting functions perform the heavy lifting by grouping, splitting, aggregating, and plotting data, often with a single line of code.

Python Installation and Jupyter Notebooks
Before getting started analyzing data, you will learn how to setup a robust environment on your system to do data science. You will install the Miniconda distribution along with all the data science libraries used throughout the course.
You will also learn how to best use Jupyter Notebooks, our main tool for exploring data.

Pandas Certification Exams
The certification exams are an instrumental part of this offer, providing you a way to test your knowledge of performing data analysis with Pandas. These exams are graded, and if passed, you will receive a certificate of completion. There are five challenging exams covering various portions of the course.

100% Satisfaction Guaranteed or your Money Back
If you aren't 100% satisfied with this course, get a full refund within 30 days.
About the Instructor
This course is taught by Ted Petrou, an expert at Python, data exploration and machine learning. He is the author of multiple highly rated texts including:
- Pandas Cookbook
- Master the Fundamentals of Python
- Master Data Analysis with Python
- Master Machine Learning with Python
- Build an Interactive Data Analytics Dashboard with Python
Ted has taught hundreds of students Python and data science during in-person classroom settings. He sees first hand exactly where students struggle and continually upgrades his material to minimize these struggles by providing a simple and direct path forward.
Ted is one of the foremost authorities on using the pandas library to do data analysis. His blog posts have totaled well over 1 million views. He is also a prolific contributor on Stack Overflow having answered over 400 questions. He is an enthusiastic instructor and dedicates his time to helping students at their desk during exercises to ensure understanding.
Ted demonstrates his deep fluency in Python by developing open source Python libraries and is the creator of dexplo, a suite of data science packages that include bar_chart_race, dexplot, jupyter_to_medium, and dataframe_image.
Ted holds a Master's degree in Statistics from Rice University.

Testimonials

Want to sample our material first?
Sign up here to get access to our amazing Intro to Pandas course, which comes with video lessons, 100+ exercises, and a certification exam.
Download the table of contents
Take a look at the titles of the 70+ chapters of Master Data Analysis with Python
Video Lessons
Video lessons for first six parts of Master Data Analysis have been produced. There are a total of 10 hours of video that cover nearly every section in those parts. Videos for the rest of the book are being created now and will be available soon. The following video is one of several dozen from the part Essential Series Commands covering sorting by both the values and the index.
"in my opinion what distinguishes you from everyone is your deep understanding of Python and Pandas. I follow lot of people on twitter, linkedin, Medium who share tips/tricks/codes on Python, Pandas, scikit-learn but no one comes close to you when writing efficient code and explaining the finer nuances"
Master Data Analysis with Python student
Exercise Solution Videos
All exercises from the course are solved by Ted on video so that you can see exactly how he thinks through a problem. The following video shows exercise solutions from the chapter Sorting, Ranking, and Uniqueness of the Essential Series Commands part.
What your purchase includes
You are purchasing a digital download along with access to all videos currently produced. The digital download includes the following:
- 70+ Jupyter Notebook where you can read the text, complete exercises, and add notes.
- 850+ page PDF of the text allowing you to search for specific content or read when not online.
- 500+ exercises with detailed solutions to practice what you've learned.
- 10 hours of video of thorough and clear explanations of the text and solutions to exercises.
- 5 challenging certification exams that are graded with certificates of completion if passed.

Updated for pandas 1.0
All of the code in Master Data Analysis with Python has been updated to work with pandas 1.0, the latest new major version released. The material is regularly updated and changed so that you can feel confident you are getting the most modern and best practices for using pandas.

Prerequisites
Master Data Analysis assumes you already have a solid understanding of the fundamentals of Python. If you do not, you should master these fundamentals first. Master the Fundamentals of Python provides the necessary prerequisite knowledge.
This book assumes no knowledge of any of the Python data science libraries. Each part progresses slowly and thoroughly beginning with the basics. Advanced topics are covered towards the last chapters in each part.
Want to become an expert?
If you are trusted to make decisions using pandas, you'll need to master it.
