
Displaying Pandas DataFrames Horizontally in Jupyter Notebooks

In this tutorial, you’ll learn how to display pandas DataFrames horizontally in your Jupyter Notebooks. I find this useful when presenting data to an audience or when delivering tutorials like this one.
Default DataFrame Display
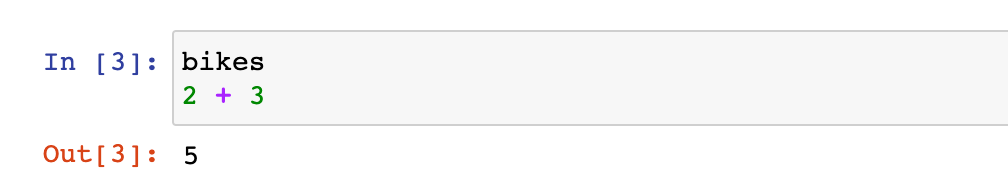
Let’s begin by reading in three different DataFrames, assigning them to variable names. By default, nothing is displayed in the output when an assignment statement is the last line of a notebook cell.
import pandas as pd
bikes = pd.read_csv('bikes.csv', nrows=3)
flights = pd.read_csv('flights.csv', nrows=3)
housing = pd.read_csv('housing.csv', nrows=3)
If the variable name is displayed as the last line in a notebook, then it will be displayed in the output. Here, we output the bikes DataFrame.
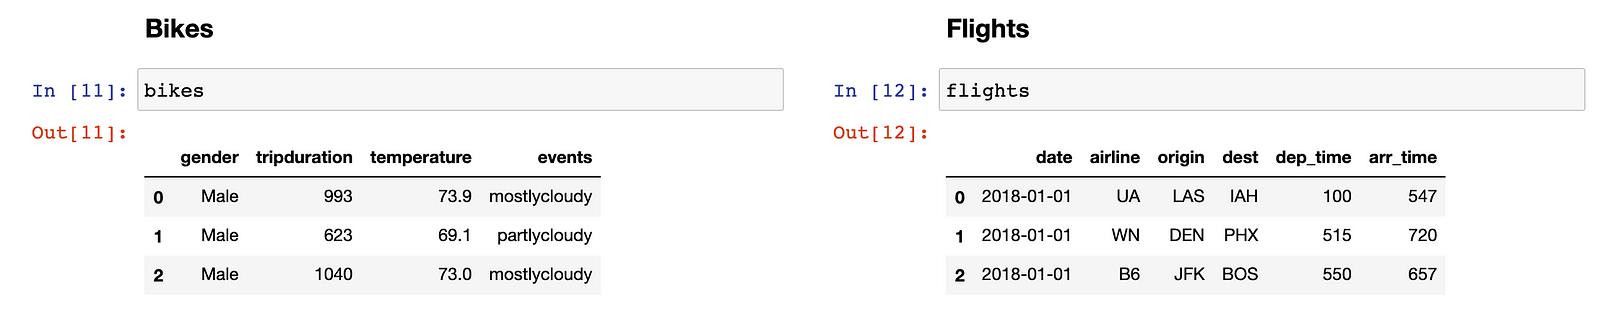
bikes
If there is any non-comment line beneath the DataFrame, then it won’t be displayed in the cell. Here, we perform a simple arithmetic operation as our last line which gets evaluated and output.
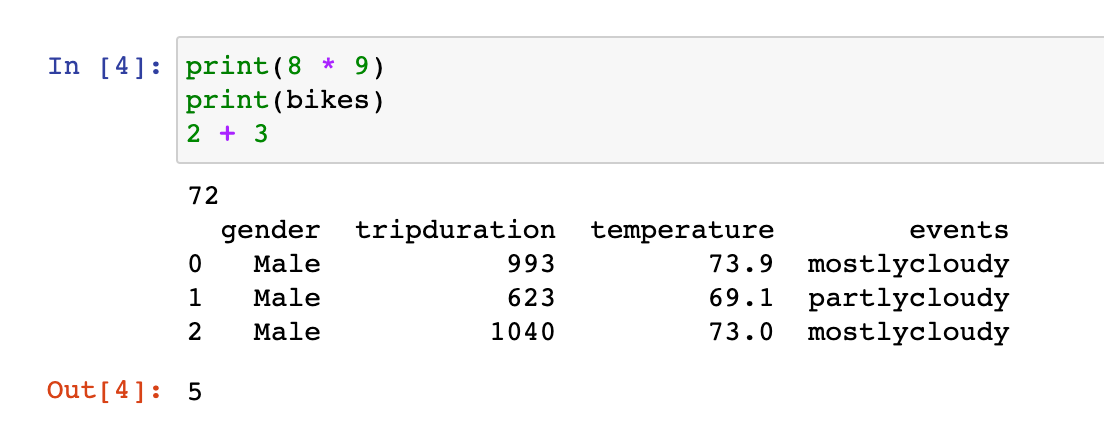
The print function may be used to output other lines that do not appear as the last line. Here, both an arithmetic operation and a DataFrame are output to the screen.
Why is the visual display of the DataFrame different?
The visual display of the DataFrame is different when using the print function. This is because a different mechanism is used. The print function searches for the __repr__ method and uses it for objects that define it. With pandas DataFrames, it is defined, and returns a string. It is this string that is printed to the string.
bikes.__repr__()' gender tripduration temperature events\n0 Male 993 73.9 mostlycloudy\n1 Male 623 69.1 partlycloudy\n2 Male 1040 73.0 mostlycloudy'When outputting DataFrames to the screen when they appear as the last line of a cell, the notebooks checks to see if a _repr_html_ method is defined for the object. DataFrames have it defined and return a string of HTML with the values of the DataFrame in it. This string, which is printed below, is used by the notebook to display it nicely.
print(bikes._repr_html_())<div>
<style scoped>
.dataframe tbody tr th:only-of-type {
vertical-align: middle;
}
.dataframe tbody tr th {
vertical-align: top;
}
.dataframe thead th {
text-align: right;
}
</style>
<table border="1" class="dataframe">
<thead>
<tr style="text-align: right;">
<th></th>
<th>gender</th>
<th>tripduration</th>
<th>temperature</th>
<th>events</th>
</tr>
</thead>
<tbody>
<tr>
<th>0</th>
<td>Male</td>
<td>993</td>
<td>73.9</td>
<td>mostlycloudy</td>
</tr>
<tr>
<th>1</th>
<td>Male</td>
<td>623</td>
<td>69.1</td>
<td>partlycloudy</td>
</tr>
<tr>
<th>2</th>
<td>Male</td>
<td>1040</td>
<td>73.0</td>
<td>mostlycloudy</td>
</tr>
</tbody>
</table>
</div>The display function
All notebooks load a display function by default, which can be used to display the normal DataFrame from anywhere in the cell. This avoids the uglier output with the print function.
display(bikes)
2 + 35The display function can output any number of objects vertically. Here, we output all three DataFrames in a single output area.
display(bikes, flights, housing)

Displaying DataFrames Horizontally
In order to display DataFrames horizontally, we need to reach deeper into the tools available to control the notebook output. The display_html function from the IPython.display module allows you to display custom HTML in the notebook. Below, we build a function that accepts a dictionary of DataFrames, collects their HTML strings with the _repr_html_ method and places all of inside a single div element that uses the CSS flexbox layout.
This flexbox layout displays each item horizontally. Each item in the flexbox is an HTML table element containing the DataFrame values.
from IPython.display import display_html

def display_dfs(dfs, gap=50, justify='center'):
    html = ""
    for title, df in dfs.items():
        df_html = df._repr_html_()
        cur_html = f'<div> <h3>{title}</h3> {df_html}</div>'
        html +=  cur_html
    html= f"""
    <div style="display:flex; gap:{gap}px; justify-content:{justify};">
        {html}
    </div>
    """
    display_html(html, raw=True)
We create a dictionary of our DataFrames and pass it to our custom function display_dfs which will create the flexbox and display the DataFrames horizontally.
dfs = {'Bikes': bikes, 'Flights': flights, 'Housing': housing}
display_dfs(dfs, justify='flex-start')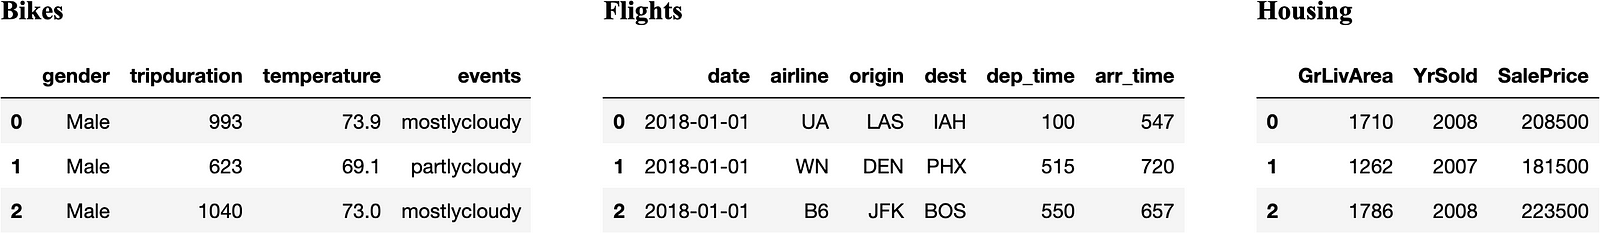
Customizing the display with HTML/CSS
If you know some HTML/CSS, you can modify the function above to display the DataFrames in a very specific manner.
Using the splitcell notebook extension
If you have the splitcell notebook extension enabled, you can split cells so that they take up half of the notebook width.
Master Data Analysis with Python
If you are looking for a comprehensive guide to Python and Pandas, check out my book, Master Data Analysis with Python. It contains 800+ pages, 500+ exercises, detailed solutions, and video lessons to help you produce trusted data analysis results in a professional environment.

Master Data Analysis with Python
Become an expert at using pandas to do data analysis with the comprehensive book Master Data Analysis with Python containing 500+ exercises and projects.
Recent Posts